Start your 14-day free trial Every Agency feature switched on. No card required.

Growth Report

The SEO reporting dashboard that shows exactly how your site is growing.

Stop guessing whether your work is paying off. AlmaSEO’s Growth Report is an SEO reporting dashboard that tracks your clicks, rankings, keywords and traffic every single day — automatically — so you always have proof your SEO is working. Every metric shows where it started and where it is now. The graph is the answer.

“Is any of this actually working?”

It’s the question behind every SEO engagement, and most people answer it from memory. You logged into Search Console a few times, the number looked bigger than last time you checked, and you called it progress. When the client asks, you screenshot whatever graph is highest that day.

The problem isn’t the data — it’s that nobody wrote down where you started. Without a baseline, “clicks are up” is a feeling, not a fact. You can’t prove improvement you never measured from a starting line.

AlmaSEO draws the starting line for you the day you connect a site, then records the numbers every day after. The Growth Report is where all of it lands: one tab, every metric, with the before-and-after already calculated. You stop guessing because the comparison is sitting right there.

For the owner who wants a straight answer — and the agency that has to prove it.

For the business owner or solo SEO

Am I getting more clicks? Are my rankings improving?

You don’t want a dashboard with forty widgets. You want to know if the money and hours are moving the needle. The Growth Report puts the handful of numbers that matter on one screen, each with an arrow that’s green or red.

  • Clicks, impressions, rankings and traffic in one view
  • A green or red delta on every metric — no math required
  • Free on every plan, including Solo — no credits to spend
For the freelancer or agency

The report that keeps the client from wondering.

Clients don’t churn because rankings dropped — they churn because they can’t see progress. A page that shows their clicks and keywords climbing since the day you started is the cheapest retention you’ll ever run, and it built itself while you worked.

  • The Growth Report IS the case study — proof, not promises
  • Before/after on every metric quantifies the improvement
  • It fills in daily on its own — nothing to compile

Everything that moved, plotted against where it started.

The Growth Report is a full SEO performance dashboard: it opens with the summary, then lays out the trend lines behind each number — an analytics dashboard for your search, traffic and ranking data on one screen. Pick a window — 30 days, 90 days, 6 months or a year — and every chart redraws to match.

KPI Summary Cards

The whole answer, before you scroll.

Current value, and the change since day one

Each card shows where a metric stands now and the percentage it’s moved since your very first data point — a green arrow up, a red arrow down. The baseline is the first number AlmaSEO ever recorded, so the comparison is honest.

The metrics that decide the engagement

Clicks, impressions, average position, keywords ranked, estimated traffic — the numbers a client actually asks about, each with its own before-and-after, sitting at the top of the tab.

Plan Every plan — Solo, Pro and Agency.

ShowsPercentage deltasGreen up / red downBaseline from first recordAt-a-glance summary

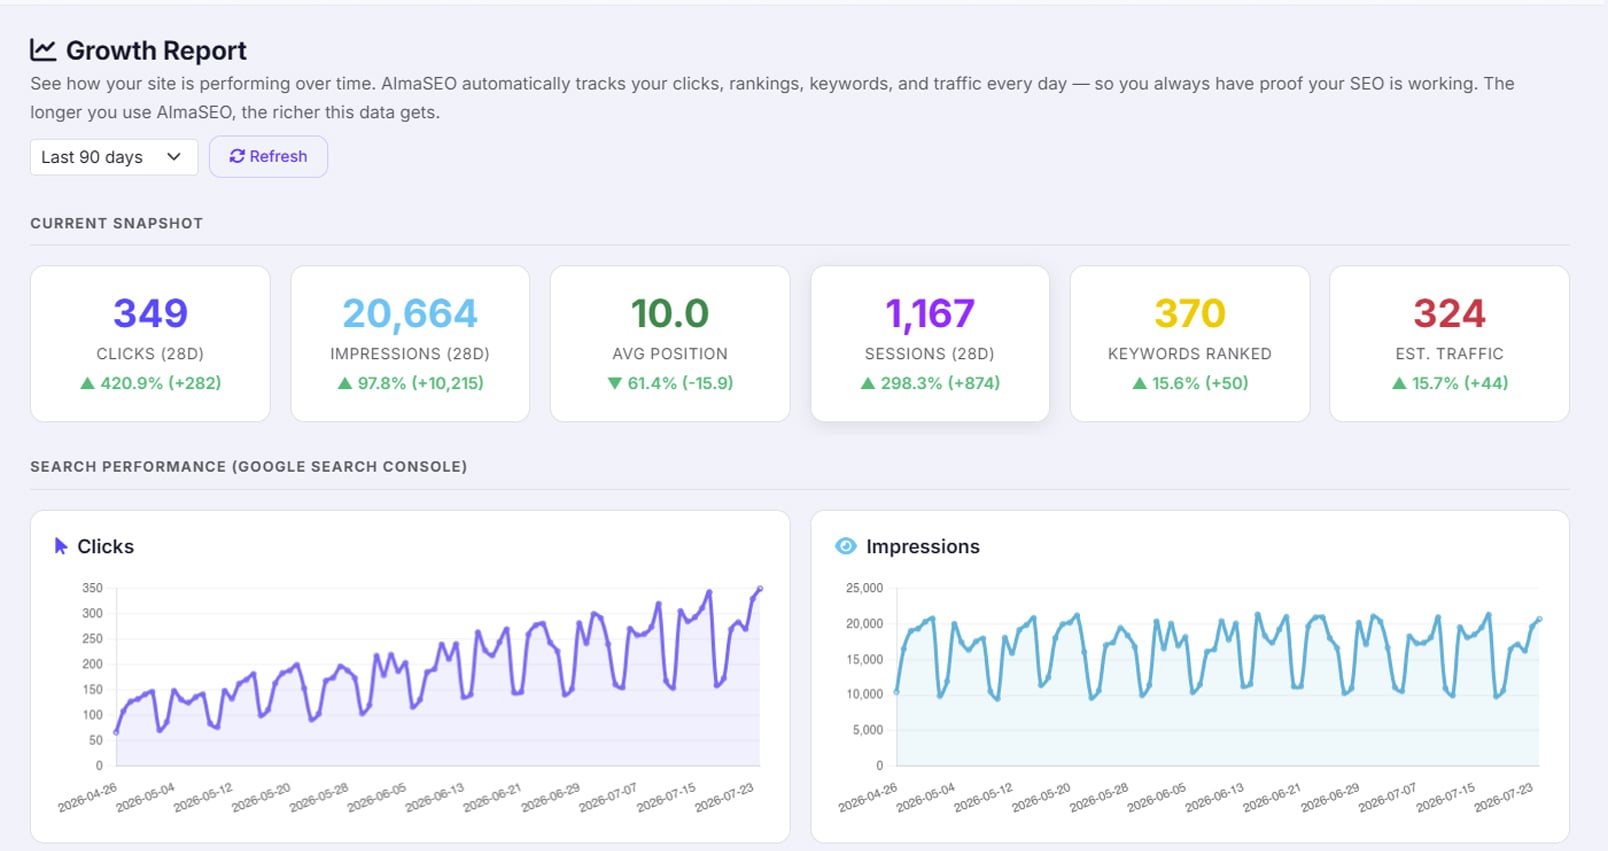
The Growth Report tab open to its Current Snapshot — six KPI cards with color-coded deltas above daily Clicks and Impressions charts
The Growth Report open to its Current Snapshot. Six KPI cards each pair the current value with the change since the first data point — Clicks 349 (▲ 420.9%), Impressions 20,664 (▲ 97.8%), Average Position 10.0, Sessions 1,167 (▲ 298.3%), Keywords Ranked 370 (▲ 15.6%) and Estimated Traffic 324 (▲ 15.7%), green for improvement. A Last 90 Days range selector sits at the top, and below the cards the daily Clicks and Impressions line charts run from late April to late July — the clicks line climbing steadily over the window.

Search Console trends

Your Google search performance, day by day.

Clicks and impressions over time

The two numbers that tell you whether Google is showing you more and whether people are choosing you when it does — drawn as daily line charts, not a single week’s snapshot.

Average position and click-through rate

Watch your ranking climb and your CTR respond. When position improves but clicks don’t, the line tells you it’s a title-and-description problem, not a ranking one.

Plan Every plan.

ShowsClicksImpressionsAverage positionClick-through rateDaily granularity

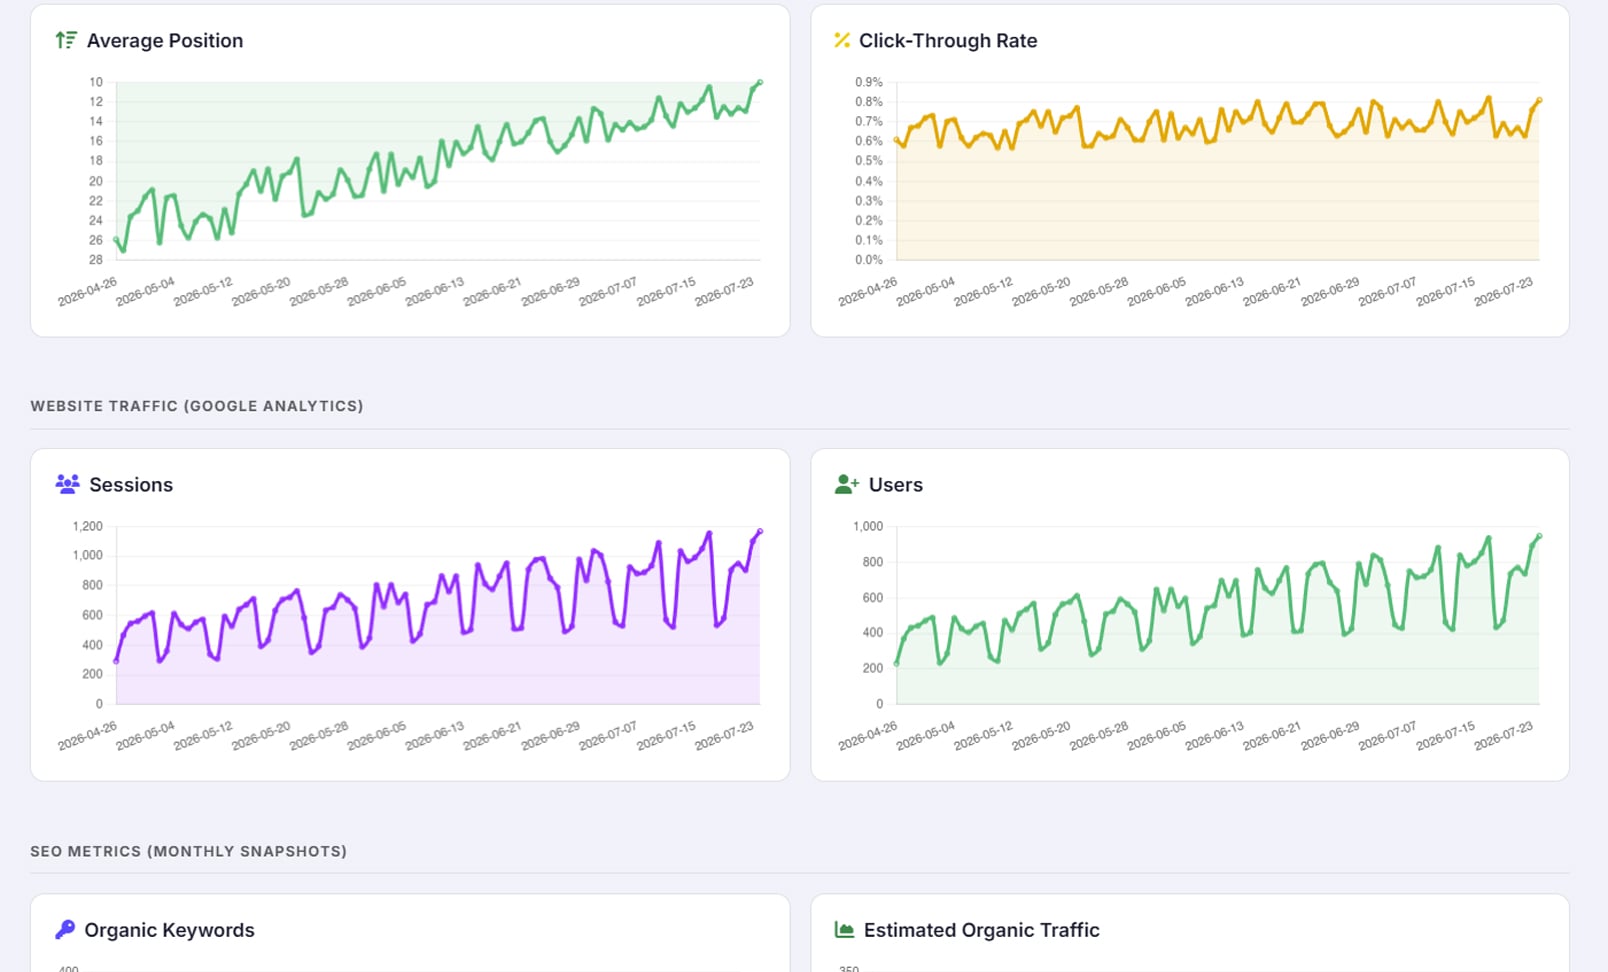
Search Console and Analytics trend charts in the Growth Report — Average Position and Click-Through Rate above daily Sessions and Users
The trend section of the same tab. Up top, Search Console’s Average Position climbs from about 26 to 10 over three months while Click-Through Rate holds around 0.6–0.8%. Under a Website Traffic (Google Analytics) heading, daily Sessions and Users both trend upward across the same window, and the SEO Metrics (monthly snapshots) section — Organic Keywords and Estimated Organic Traffic — begins below.

Analytics trends

What happens after the click.

Sessions and users, tracked daily

Search Console tells you about the search; Analytics tells you about the visit. Sessions and users plotted over the same window show whether the traffic you’re winning is actually landing and growing.

Plan Every plan.

ShowsSessionsUsersDaily line charts

SEO metrics

The bigger picture, refreshed monthly.

Organic keywords ranked

How many keywords your domain ranks for, captured as a monthly snapshot. A line that climbs month over month is the clearest single sign that your visibility is widening, not just deepening on the terms you already had.

Estimated organic traffic

The independent traffic estimate for your domain, tracked alongside your keyword count so you can see reach and rankings move together.

Plan Every plan.

ShowsOrganic keywords rankedEstimated organic trafficMonthly snapshotsPowered by SE Ranking

Quality Scores

Whether the pages themselves are getting better.

First Impression score over time

AlmaSEO’s read on how a page lands — plotted as it changes, so the work you do on a page shows up as a line that moves, not a one-off grade you forget.

AI Search Readiness score over time

How prepared your content is to be cited by AI search, tracked on the same timeline. As ChatGPT and Google’s AI answers eat more clicks, this is the score you want climbing.

Plan Every plan.

ShowsFirst ImpressionAI Search ReadinessPlotted over time

Content Published

Effort, made visible.

Articles published per day

A bar chart of what actually shipped. Lay it next to the traffic line and the cause-and-effect writes itself — the weeks you published are the weeks the other charts turn up.

Plan Every plan.

ShowsArticles per dayBar chartPublishing cadence

You don’t build this report. It builds itself.

This is automated SEO reporting in the literal sense: there is no “generate report” button to remember and no spreadsheet to keep. The moment a site is connected, AlmaSEO starts recording — and keeps recording every day, whether you log in or not.

Search, Analytics and Business Profile — captured daily.

Every morning at 4:30 AM UTC, AlmaSEO pulls the day’s Search Console, Analytics and Business Profile numbers and files them. It runs on Google’s own API, so this daily history costs nothing and spends none of your credits.

Keywords and organic traffic — snapshotted monthly.

On the 1st of every month, AlmaSEO records your domain’s keyword count and estimated organic traffic from SE Ranking. Month-over-month is the right cadence for the big-picture numbers — daily noise would only obscure the trend.

Scores and content — already being tracked.

First Impression, AI Search Readiness and everything you publish are recorded as you use AlmaSEO normally. By the time you open the Growth Report, that history is already there — nothing extra to switch on.

Because the report is a record that accumulates, the honest promise is this: the day you connect a site is day zero. Connect it now and in a month you’ll have a month of proof — which is exactly why the best time to turn it on is before you start the work, not after a client asks how it’s going.

On every plan. No credits. Nothing to meter.

Most of what AlmaSEO can do on demand draws down Data Credits. The Growth Report doesn’t. Its data is collected automatically on free Google APIs and a monthly SE Ranking pull, so watching your own growth never costs you a thing — on Solo, Pro or Agency alike.

Solo

The full Growth Report, on the cheapest plan we sell. Clicks, rankings, keywords, traffic and quality scores — tracked daily, charted with deltas, no credits spent.

Pro

The same Growth Report on every site you manage — the running proof behind the client reports and invoices you send from Client Reporting & Billing.

Agency

A Growth Report per client, each one a standing case study you can point to on renewal — alongside the branded portal and cross-client view in Agency Operations.

The report reflects what you’ve connected: link Search Console, Analytics and Google Business Profile to fill every chart. Nothing breaks if a source is missing — that chart simply waits until the data starts flowing.

See a year of growth on one screen.

Open the demo and look at a site that’s been tracked over time — the KPI cards, the trend lines, and the before-and-after on every number.